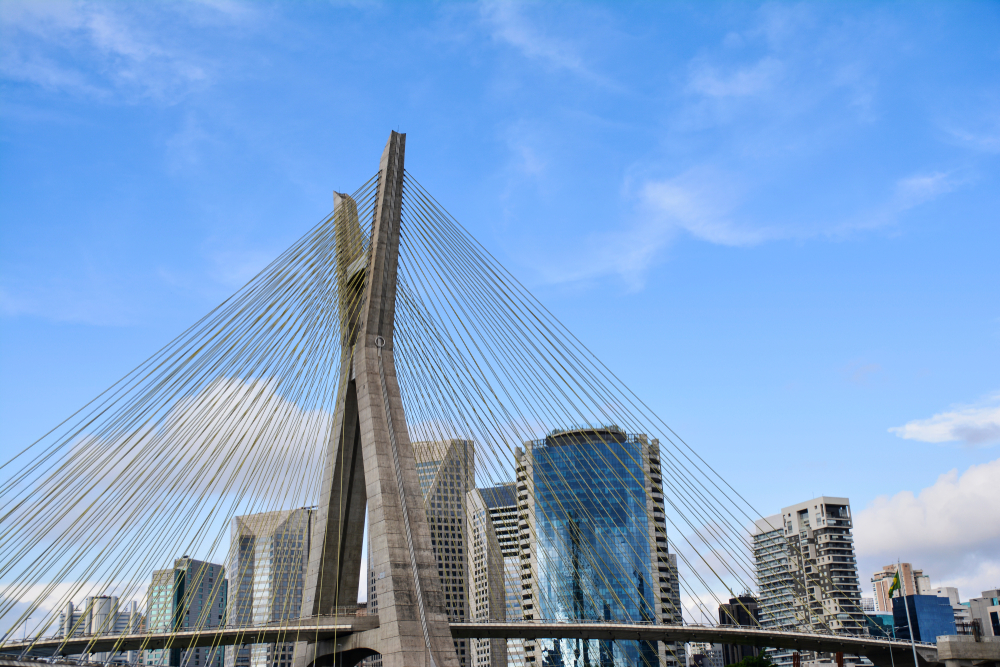
For years, cable-stayed bridges have posed risks to drivers in winter. The weight of the deck in these structures is supported by a number of nearly straight diagonal cables. Snow and ice tend to accumulate on the top of their design elements, causing car accidents if pieces break off and fall.
Chandrasekar Venkatesh, an acclaimed data scientist, has been analyzing cable-stayed bridges as a part of a research project at the University of Cincinnati. His research is a game changer, allowing us to know when accidents are most likely to occur.
What’s the problem with cable-stayed bridges?
Generally, this type of structure is very pleasing to the eye but it is not best suited for harsh winters. During particular weather conditions, snow or ice that accumulates on the stays eventually breaks off in large pieces. Imagine a snow bomb falling on your car while driving 60 miles per hour.
Another problem on these bridges is the material that cable-stayed bridges are built from: stainless steel is susceptible to ice formation.
When their construction first started in North America nobody realized the scale of the problem. Before that, the only other bridge with stainless steel stays that existed in cold regions was the Uddevalla Bridge in Sweden.
Could you tell more about this project and your role in it?
Our first project was a landmark bridge in Toledo Ohio. It’s a beautiful structure, with an 8,800 feet span across the Maumee River. Back in 2008-2010, there were a few accidents on that bridge during winter.
My role was to collect data and develop an alert tool to prevent accidents — by closing the road or a few lanes to slow down traffic. At the same time, we had to prevent financial losses from unnecessary bridge closures. Not all snow and icy events cause accidents. There has to be a combination of factors, such as wind, air pressure, and etc.
Our research team installed weather sensors, collecting information from numerous sources, and processing data to learn which conditions might lead to injuries and fatalities.
What was the result of your research?
We’ve built a website and a dashboard with advanced alert tools that anyone can use. Our team came up with a simple algorithm that warns, for example, about a snowstorm coming in the next two hours. We have different levels of alerts, with “red” meaning extreme danger.
In 2017, we also significantly reduced the risks of accidents on one of the world’s largest bridges in Vancouver, Canada. The state agencies there knew that American universities were working on a similar problem so they asked us for help.
The problem in Canada was different. The bridge in Toledo was struggling with ice, but in Vancouver the problem was snow. Nevertheless, we applied similar concepts, collecting data from different sources, such as the nearby weather stations and airports. We installed sensors and came up with our own alert system.
The bridge engineers developed a system that releases chains to get rid of snow accumulating on the top of the bridge — it looks like a ring coming off your finger. And they use these dashboards to see when to release chains.
What was the most challenging part of the project for you personally?
I’ve put a lot of effort into data visualization, so the staff didn’t have to deal with complex charts and graphs. They needed simple dashboards.
Estimating costs of different accidents involving cars and trucks, and getting metrics on all of them was challenging. I had to do a lot of cost and benefit analysis.
Understanding rare patterns of weather forecasting also wasn’t easy. But I’ve been able to choose the best weather models and incorporate them into my dashboard.
It’s not that difficult to find an anomaly. You just have to find “a regular day”. If you predict that accurately, the anomaly will show itself.