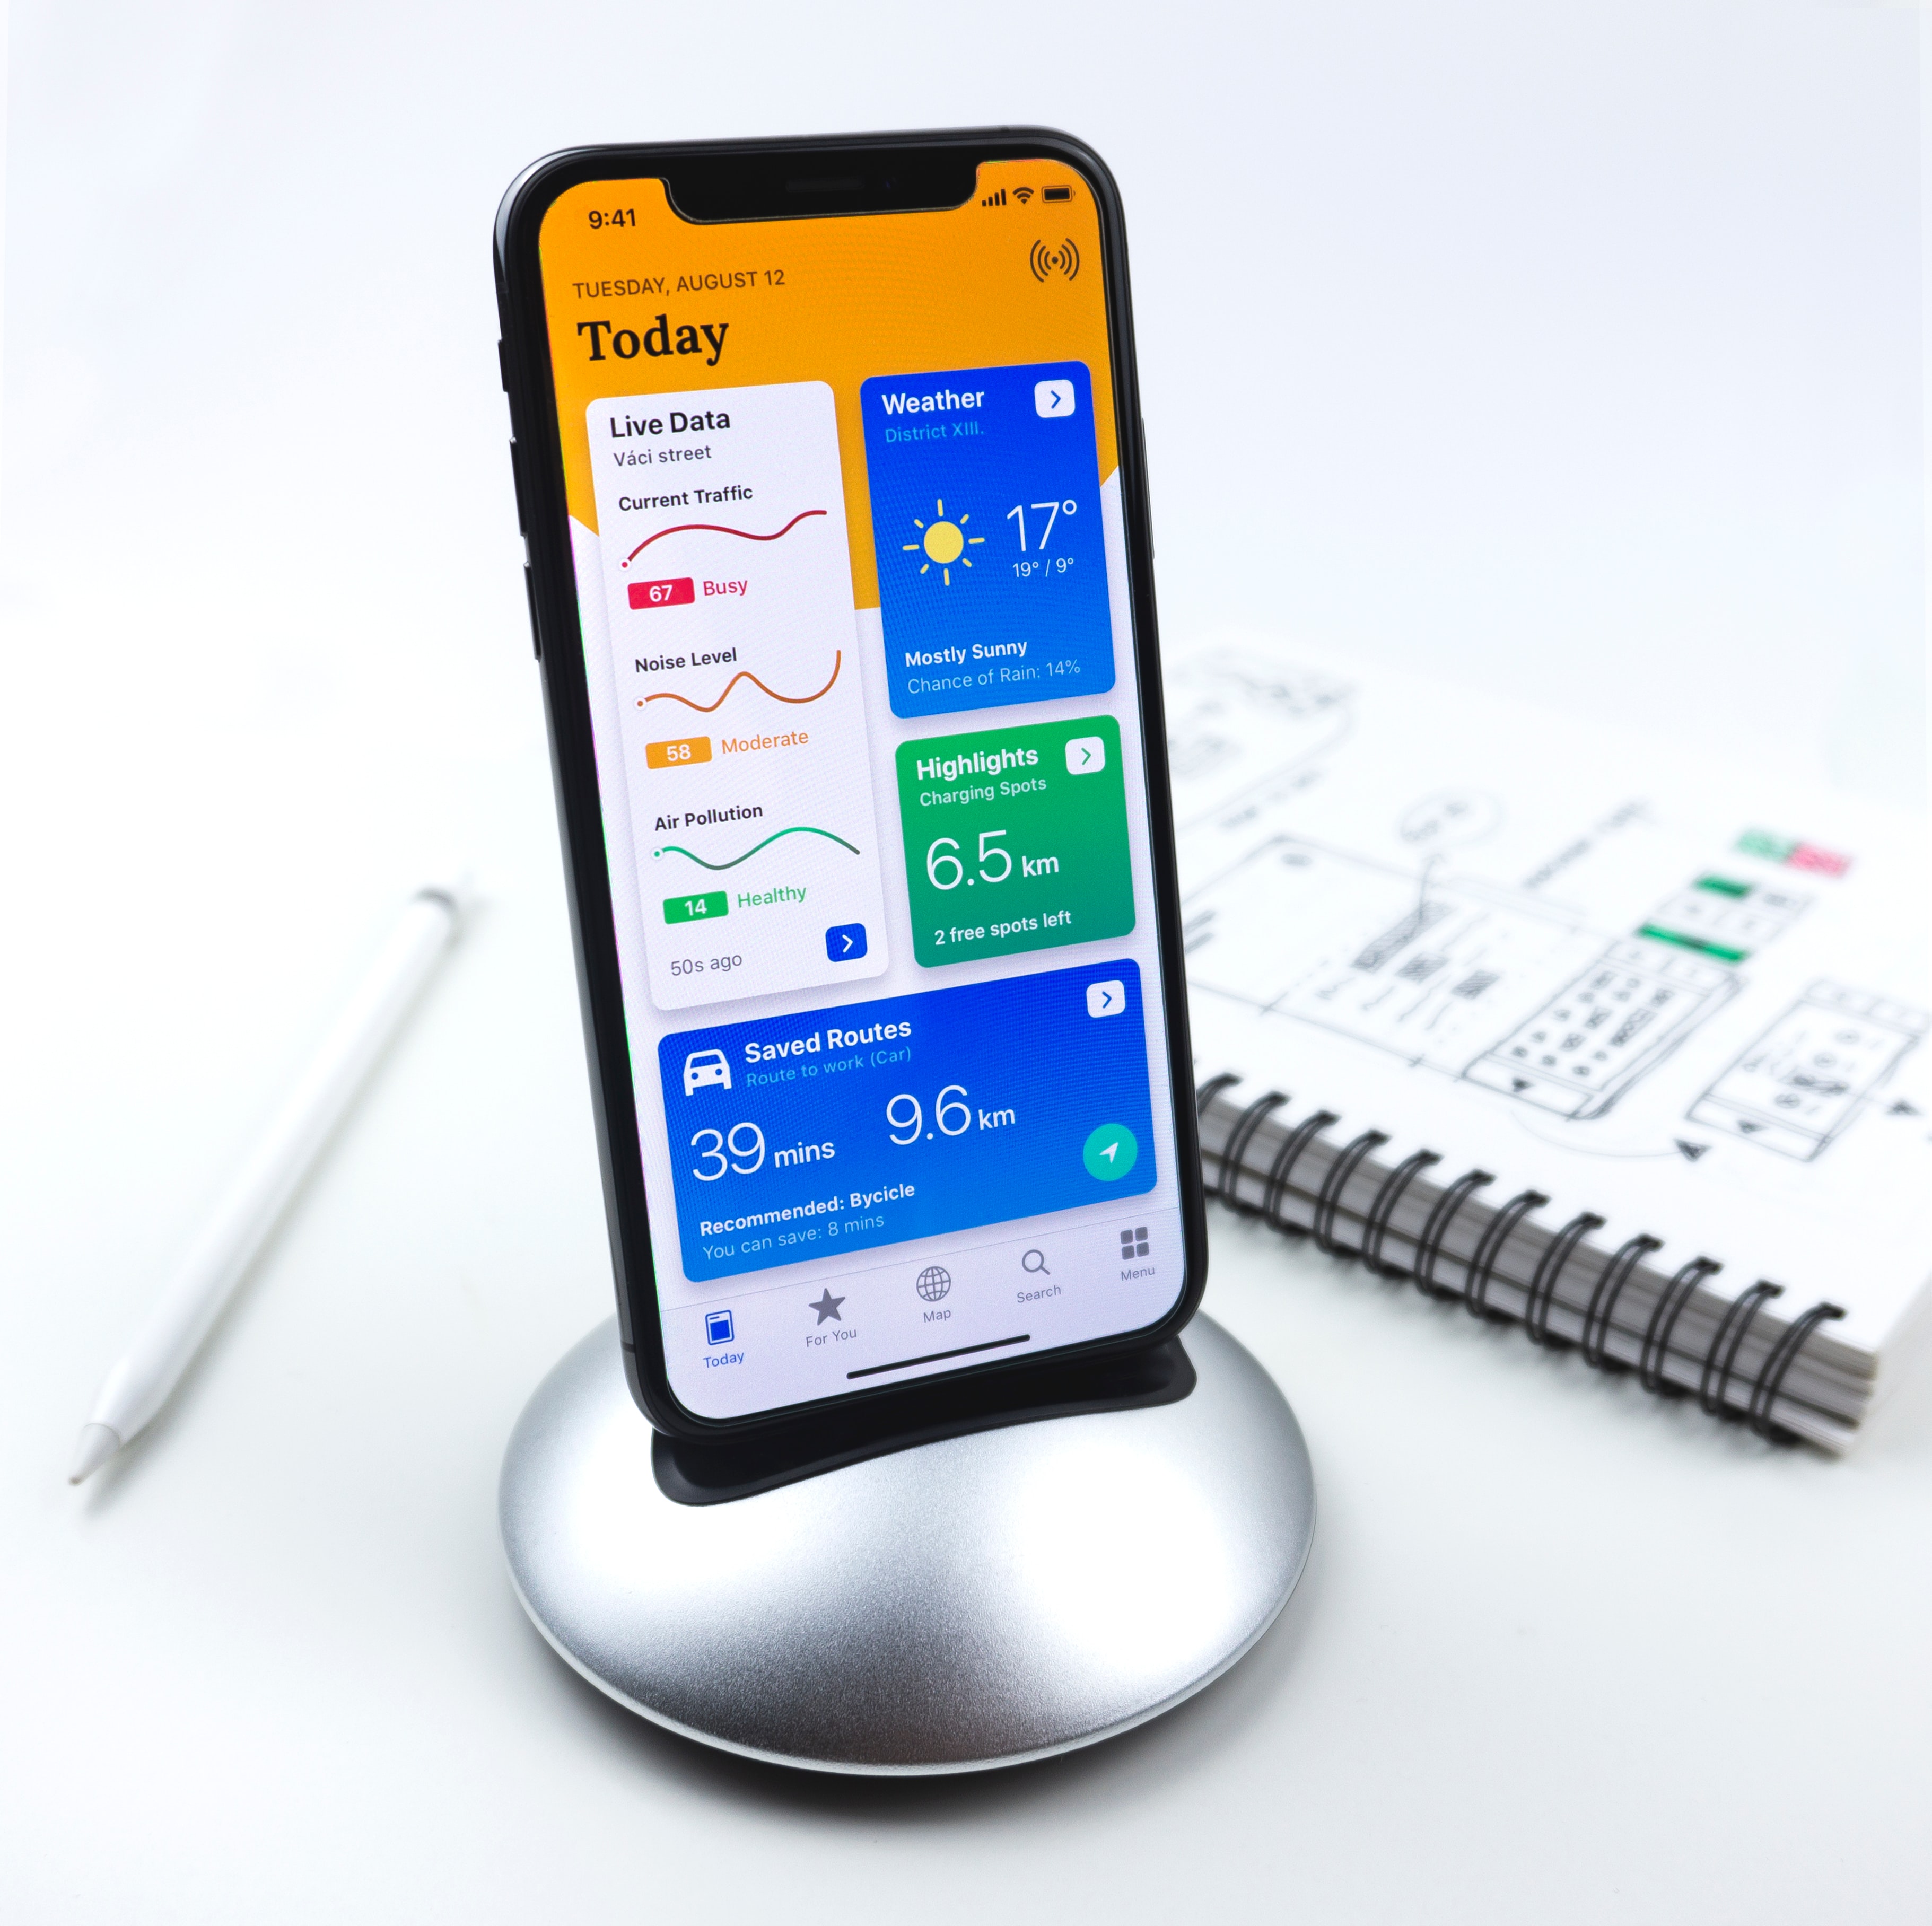
This article explores the intelligent use of technology innovation to improve leadership effectiveness at work.
By Arundati Dandapani
For productive workplaces and happier employees, leadership is boosted by increased communication, transparency and alignment on goals. One way to achieve this is through the use of effective dashboards that provide decisionmakers with relevant information to better manage their business objectives. Good business questions your dashboard might answer are: “How do I maximize the relationships to ensure the highest quality of connections?”, “How do I share meaningful metrics on new member acquisition?”, “How do I show profits against losses in Q3?” or “How do I grow student-faculty engagement on my LMS?”
“Dashboarding allows consistency where we all talk about the same story,” said Liz Connors, Director of Analytics at Headset, a North American cannabis analytics company that prides itself on using dashboards to improve data literacy and leadership, creating a common language across all business data. Her clients use dashboards to measure change over time and benchmark against competitors.
Treat technology like a co-worker
After “PowerPoint Hell,” we are seeing the “Dashboard Flood,” and we have to wade through the tsunami of information with effective visualization and data sharing, declared Alexander Skorka, Managing Director of Dapresy in an ESOMAR Masterclass. Dashboards offer greater transparency and help democratize data to all stakeholders. Half of all Canadians believe it is important to keep up with technological change, reporting that they look at their work as a “career” than just a job, according to the largest syndicated survey of the Canadian consumer by Vividata. Technology is a clear priority and commitment for professionals looking to get ahead who are willing to invest time, emotion or resources in their tools like they would in their employees.
Collaborate online
Products that speak to the unique languages, behaviours and accents of your users allow transparency and intuitive leadership. Only a third of all Canadians prefer to work as part of a team, but team-oriented dashboards became more sought after during COVID-19 as agile dashboards kept employees connected during difficult times. Teams, Slack, Zoom and other plug-ins became common integrations. Some COVID-19 dashboards allowed retailers to look at their customers’ online shopping mix and receive daily reports.
Incentivize e-learning
Eighty four percent of Canadians report it is important to commit to ongoing learning, according to Vividata. Dashboards that eliminate confusion around technology and help achieve learning milestones are piloting the next normal. Live COVID-19 dashboards communicated critical facts in real time including casualties, fatalities and recovery rates around the world.
A third of all Canadians say they want to get to the “very top” in their careers. Professionals are 34% more likely than others to want to lead and new immigrants are most ambitious. Dashboards that equip leaders-in-training with the opportunity to excel by offering rewards (badges, incentives, mentorship programs, etc.) keep workforces motivated. Dashboard modules on platforms like Skilljar deliver user-friendly training videos designed by customer success and analytics teams, issuing completion certificates users can upload to social profiles.
Leaders work hard, but also smartly. Half of all Canadians believe it is important to be good at multi-tasking. Effective dashboards have already designed all the visualizations saving you millions of hours writing SQL or designing axes—so you just need to click on questions you want answered and get served the right visualizations, whether it’s analyzing your inventory turnover or team performance instantly.
Make data literacy for everyone
Dashboards must allow business stakeholders to become self-sufficient, equipping them with necessary information quickly. However, we know that not everyone is data literate nor excited about data. Therefore, when building dashboards, make insights and data literacy a top-down initiative, providing knowledge necessary to varied audiences easily. The dashboard learning curve is less steep for medium-to-large firms, with those in R&D, marketing and sales, corporate policy, data processing and HR departments expressing more confidence with using new technology products, according to Vividata.
Using AI and infotainment techniques triggers top-down change—from C-suite teams to field workers. Enabling data and analytics novices to learn by browsing data in a controlled but engaging manner saves them the need to run to an analyst for data-related questions. Survey platform QuestionPro’s dashboards offer benefits like no start-up time and 24-7 support from skilled analysts and bots.
Be user-centric
The more you understand your users’ tasks, experiences, capabilities, preferences and habits, the better your dashboard’s performance. Use clear visualizations and engaging infographics with augmented-reality techniques to help users decode complex charts and tables that link findings to the real world. Headset’s dashboards (which take at least seven hours of market research to be created) allow you to drill down and filter by week, moving in and out of analysis and time. You could be analyzing package size trends in chocolate, pricing band trends in pre-rolls (across markets or across stores), and you could keep customizing the analyses, flipping by brands to analyze market share, answering questions like “how did holiday sales look like” or “how often are pre-rolls purchased with a flower-product (market basket analysis)” thus powering leadership in an industry where data (and data literacy) is often perceived to be limited.
As the global volume and velocity of data produced and collected only increases, leadership teams must evolve strong partnerships with IT departments to maximize their dashboard advantage. Your business question must remain at the front and centre of every visualization to tell meaningful stories that stakeholders can act on to lead effectively.
Arundati Dandapani is the Founder of Generation1.ca, a cross-sectoral resource for Canada’s newest residents, and also currently the Chief Editor of Canada’s Marketing Research and Intelligence Association MRIA-ARIM, advising non-profits and businesses on their insights and communications objectives.


